Infographics have become a powerful tool in digital marketing, allowing businesses to convey complex information in a visually appealing and easily digestible format. This guide from Webinfomatrix will walk you through essential tips and tricks for creating high-quality infographics, distributing them effectively, and leveraging their SEO benefits.
Infographic Creation & Distribution
High-Quality Infographic Creation
1. Define Your Purpose and Audience: Before starting your design, clearly define the purpose of your infographic and identify your target audience. Understanding what information is most relevant and valuable to your audience will guide your design process.
2. Choose the Right Type of Infographic: Different types of infographics serve various purposes. Select the one that best fits your content:
- Statistical Infographics: Ideal for presenting data-driven insights.
- Timeline Infographics: Perfect for showing the evolution of a process or event.
- Process Infographics: Useful for outlining steps or procedures.
- Comparison Infographics: Great for comparing two or more items.
- Hierarchical Infographics: Best for showcasing hierarchies or organizational structures.
3. Focus on Visual Appeal: High-quality infographics are visually engaging. Use a balanced color scheme, readable fonts, and high-resolution images. Ensure that your design is cohesive and aligns with your brand's style.
4. Keep It Simple: Avoid cluttering your infographic with too much information. Focus on the most important points and use concise text. Visual elements should complement the content, not overwhelm it.
5. Use Data Wisely: Ensure that your data is accurate and sourced from credible references. Use charts, graphs, and icons to represent data clearly and effectively.
6. Incorporate Branding: Integrate your brand's logo, colors, and fonts into the infographic. This not only reinforces your brand identity but also makes the infographic recognizable.
7. Optimize for Mobile: With many users accessing content on mobile devices, ensure your infographic is responsive and looks good on smaller screens.
Infographic Distribution
1. Leverage Social Media: Share your infographic on platforms like Facebook, Twitter, LinkedIn, and Instagram. Tailor your post to each platform to maximize engagement.
2. Use Your Website and Blog: Publish the infographic on your website or blog. Create a dedicated landing page or blog post that explains the infographic in detail and includes a downloadable version.
3. Email Marketing: Include the infographic in your email newsletters. A visually engaging infographic can increase click-through rates and drive more traffic to your site.
4. Collaborate with Influencers: Partner with industry influencers or bloggers who can share your infographic with their audience, increasing its reach.
5. Submit to Infographic Directories: Submit your infographic to high DA (Domain Authority) infographic directories to gain more exposure and backlinks.
6. Engage in Content Syndication: Allow other websites or blogs to republish your infographic. This can drive additional traffic and enhance your content's reach.
High-Quality Infographic Creation
1. Start with a Strong Concept: A well-thought-out concept is the foundation of a successful infographic. Brainstorm ideas and create a clear outline of the information you want to present.
2. Choose a Professional Design Tool: Use design tools like Adobe Illustrator, Canva, or Piktochart to create your infographic. These tools offer advanced features and templates that can help streamline the design process.
3. Prioritize Readability: Ensure that your text is legible. Use font sizes and styles that are easy to read, and make sure there is enough contrast between text and background.
4. Include Clear and Relevant Visuals: Incorporate visuals that enhance understanding. Avoid using generic stock images; instead, use custom graphics or data visualizations that are specific to your content.
5. Test and Refine: Before finalizing your infographic, test it with a small audience to gather feedback. Use this feedback to make necessary adjustments and improve the final design.
Types of Infographics
Statistical Infographics:
- Purpose: Present statistical data in a visually engaging manner.
- Example: Infographics displaying survey results or market trends.
Timeline Infographics:
- Purpose: Show the chronological progression of events or processes.
- Example: A timeline of technological advancements in a specific field.
Process Infographics:
- Purpose: Outline steps in a process or workflow.
- Example: A step-by-step guide to starting a new project.
Comparison Infographics:
- Purpose: Compare two or more items or concepts.
- Example: A comparison of different software tools or services.
Hierarchical Infographics:
- Purpose: Display hierarchical relationships or organizational structures.
- Example: An organizational chart or a hierarchy of decision-making processes.
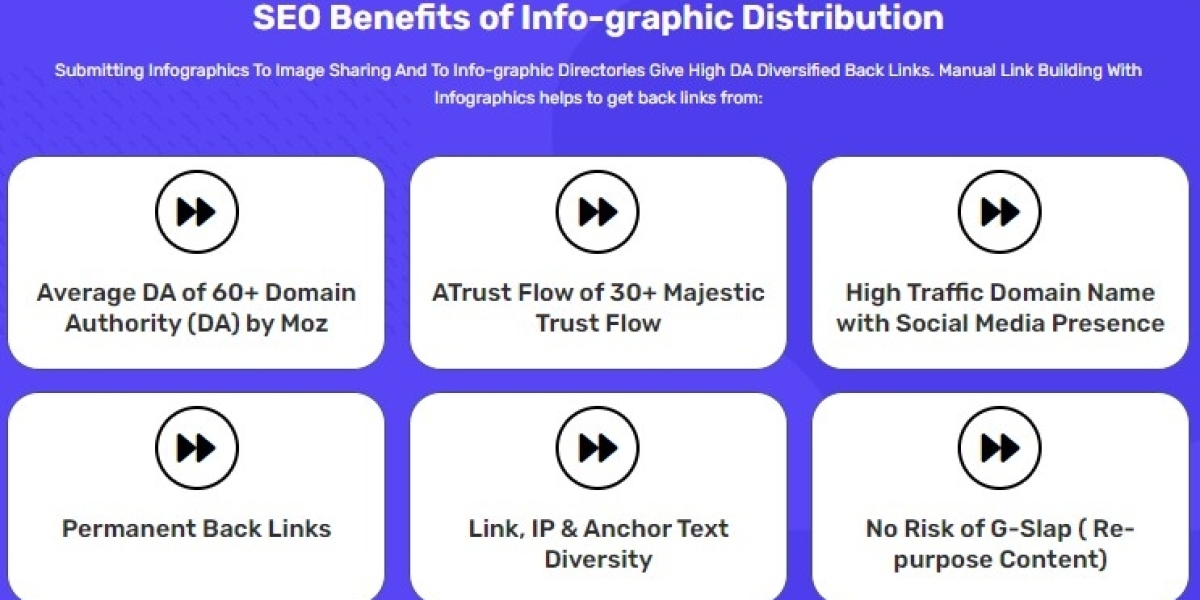
SEO Benefits of Infographic Distribution
1. Increased Backlinks: Publishing infographics on your website and submitting them to directories can generate high-quality backlinks. These backlinks improve your website's domain authority and search engine ranking.
2. Enhanced User Engagement: Infographics are highly shareable and can increase user engagement. When users find your content valuable, they are more likely to share it, further boosting your SEO efforts.
3. Improved On-Page SEO: Incorporate relevant keywords and alt text in your infographic's file name and description. This practice helps search engines understand the content and improves your on-page SEO.
4. Increased Time on Page: Well-designed infographics can keep users on your page longer. This increased dwell time signals to search engines that your content is valuable, potentially improving your search rankings.
5. Greater Social Media Visibility: Infographics are visually appealing and tend to perform well on social media platforms. Increased social shares can drive more traffic to your website and enhance your overall SEO strategy.
List of High DA Infographic Directories
- Visual.ly: A popular platform for submitting and discovering infographics.
- Infographic Journal: A directory focused on sharing and showcasing infographics.
- Daily Infographic: A site that features a curated selection of high-quality infographics.
- Submit Infographics: Allows users to submit and promote their infographics.
- Infographics Archive: A comprehensive archive of infographics on various topics.
List of High DA Photo Sharing Sites
- Pinterest: A leading platform for visual content and infographics.
- Flickr: A well-known photo-sharing site that can be used to share infographics.
- Instagram: Ideal for sharing visually appealing infographics with a wide audience.
- Behance: A platform for creative professionals to showcase their work, including infographics.
- Dribbble: A community for designers to share and discover creative projects, including infographics.
Creating and distributing high-quality infographics is a powerful way to engage your audience and enhance your digital marketing efforts. By following the tips and best practices outlined in this guide, you can design visually appealing infographics, distribute them effectively, and leverage their SEO benefits. Remember to continuously monitor performance and make adjustments based on feedback and analytics to maximize the impact of your infographic strategy.
Get in Touch
Website – https://www.webinfomatrix.com
Mobile - +91 9212306116
Whatsapp – https://call.whatsapp.com/voice/9rqVJyqSNMhpdFkKPZGYKj
Skype – shalabh.mishra
Telegram – shalabhmishra
Email - info@webinfomatrix.com